House mouse vs Syrian hamster: how their vision differs
Two animals people expect to see alike, or very differently. Here are their values side by side, from the same catalogue and with the same evidence labels.
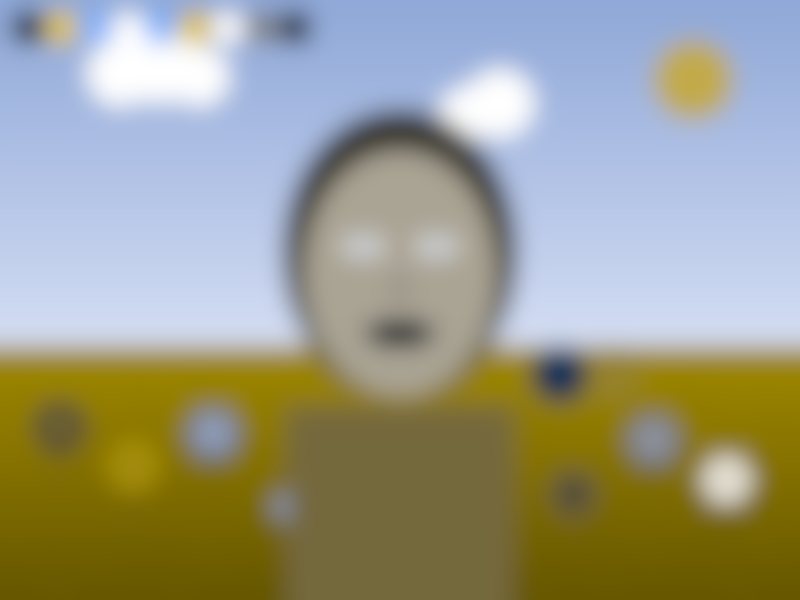

The differences in numbers
- Both have 2 colour receptor classes in this dataset, so any difference in the renders comes from the other dials and the receptor peaks.
- The Syrian hamster resolves finer detail: 0.525 vs 0.5 cycles per degree, about 1.1 times finer.
- Flicker fusion: 41.3 Hz for the house mouse, 62.5 Hz for the Syrian hamster. The higher value sees fast motion in finer time steps.
- Binocular overlap: 40° vs 80°.
Dial by dial
| Dial | House mouse | Syrian hamster |
|---|---|---|
| Colour | Ultraviolet: yes: at least one receptor peaks in the ultraviolet Measured | Colour receptors: 2 receptor classes: 360 nm (UVS), 508 nm (MWS (green)) Measured[1] Ultraviolet: yes: at least one receptor peaks in the ultraviolet Measured |
| Sharpness | Acuity: 0.5 cycles per degree Measured[3] | |
| Field of view | Binocular overlap: 40° Measured[5] Eye placement: lateral Derived[5] | Binocular overlap: 80° Measured[5] |
| Sharp zones (foveas) | Number of foveas: 0 Measured[6] Fovea type: area centralis Measured[6] | Number of foveas: 0 Measured[6] Fovea type: area centralis Measured[6] |
| Night vision | Pupil shape: circular Group default[13] Reflective layer (tapetum): no Measured[14] | |
| Motion (flicker fusion) | Flicker fusion frequency: 41.3 Hz Measured[16] |
Vision types: House mouse: Small prey mammal (UV). Syrian hamster: Small prey mammal (UV).
More comparisons: all comparisons.
Sources
- Longcore T. 2023. A compendium of photopigment peak sensitivities and visual spectral response curves of terrestrial wildlife to guide design of outdoor nighttime lighting. Basic Appl Ecol 73:40-50. doi:10.1016/j.baae.2023.09.002. doi.org/10.5281/zenodo.8432720
- VPOD in-vivo (MSP / single-cell) lambda max compendium, file scp_cleaned.csv, VPOD GitHub (Frazer et al. 2025 bioRxiv 10.1101/2025.08.22.671864). github.com/VisualPhysiologyDB/visual-physiology-opsin-db/tree/main/scripts_n_notebooks/vpod_ML_workflows/mine_n_match/data_sources/lmax/vpod
- Veilleux CC, Kirk EC 2014. Visual acuity in mammals. Brain Behav Evol 83:43, Supplementary Table 1 (cleaned CSV in Evo-M1-Trait-Data). doi.org/10.1159/000357830
- Caves EM, Fernandez-Juricic E, Kelley LA (2024) Ecological and morphological correlates of visual acuity in birds. J Exp Biol 227(2): jeb246063. Supplementary Table S1.. doi.org/10.1242/jeb.246063
- Heesy CP 2004. On the relationship between orbit orientation and binocular visual field overlap in mammals. Anat Rec 281A:1104, Table 1. doi.org/10.1002/ar.a.20116
- Kopania EEK, Clark NL. 2025. Mammalian retinal specializations for high acuity vision evolve in response to both foraging strategies and morphological constraints. Evolution Letters 9: qrae072. Supplementary Tables S1-S2.. doi.org/10.1093/evlett/qrae072
- Anderson SR, Wiens JJ. 2017. Out of the dark: 350 million years of conservatism and evolution in diel activity patterns in vertebrates. Evolution 71:1944-1959. Dryad doi:10.5061/dryad.fg700. doi.org/10.5061/dryad.fg700
- Borges R, Johnson WE, O'Brien SJ, Gomes C, Heesy CP, Antunes A (2018) Adaptive genomic evolution of opsins reveals that early mammals flourished in nocturnal environments. BMC Genomics 19:121
- Wilman et al. 2014 EltonTraits 1.0, MamFuncDat.txt. doi.org/10.6084/m9.figshare.3559887.v1
- Maor R, Dayan T, Ferguson-Gow H, Jones KE. 2017. Temporal niche expansion in mammals from a nocturnal ancestor after dinosaur extinction. Nature Ecology & Evolution 1:1889-1895. Supplementary Table 1. doi.org/10.1038/s41559-017-0366-5
- Schmitz L, Motani R. 2011. Science 332:705-708, SOM. doi.org/10.1126/science.1200043
- Moura et al. 2024. A phylogeny-informed characterisation of global tetrapod traits addresses data gaps and biases. PLoS Biol 22:e3002658. TetrapodTraits v3.0.1.. doi.org/10.5281/zenodo.22536349
- Banks MS, Sprague WW, Schmoll J, Parnell JAQ, Love GD. 2015. Science Advances 1:e1500391. doi.org/10.1126/sciadv.1500391
- Shibuya K, Tomohiro M, Sasaki S, Otake S. 2015. Characteristics of structures and lesions of the eye in laboratory animals used in toxicity studies. Journal of toxicologic pathology 28(4):181-188. doi.org/10.1293/tox.2015-0037
- Jones KE et al. 2009. PanTHERIA: a species-level database of life history, ecology, and geography of extant and recently extinct mammals. Ecology 90:2648. Ecological Archives E090-184. doi.org/10.1890/08-1494.1
- Lafitte A, Sordello R, Legrand M, Nicolas V, Obein G, Reyjol Y. 2022. A flashing light may not be that flashy: A systematic review on critical fusion frequencies. PLoS ONE 17(12): e0279718. S10 File (CFF database). doi.org/10.1371/journal.pone.0279718
- Haarlem CS, Hynes C, Jackson AL, Mitchell KJ, O'Connell RG, Healy K. 2026. Pace of ecology drives the tempo of visual perception across the animal kingdom. Nature Ecology & Evolution (doi:10.1038/s41559-026-02994-7). Figshare dataset 10.6084/m9.figshare.30556475. doi.org/10.6084/m9.figshare.30556475
- Healy K, McNally L, Ruxton GD, Cooper N, Jackson AL. 2013. Metabolic rate and body size are linked with perception of temporal information. Animal Behaviour 86:685-696. Table 1. doi.org/10.1016/j.anbehav.2013.06.018
- Inger R, Bennie J, Davies TW, Gaston KJ. 2014. Potential biological and ecological effects of flickering artificial light. PLoS ONE 9(5): e98631. Table 3. doi.org/10.1371/journal.pone.0098631
Renders use the sample scene at a 60° field of view in daylight. Evidence levels: how the tiers work.